
Critical value is a pivotal parameter that determines the acceptance or rejection of a hypothesis test. It serves as the benchmark against which calculated test statistics are compared to measure the statistical significance of results.
Derived from specific probability distributions (like t-distribution or chi-square distribution), this value signifies the threshold beyond which a hypothesis is considered improbable or rare based on a chosen significance level (usually 5% or 1%). It indicates sufficient evidence to reject the null hypothesis in favor of an alternative if the calculated test statistic exceeds this critical value.
Understanding and correctly identifying the critical value is fundamental in drawing meaningful conclusions from data and guiding researchers and analysts in making informed decisions about the validity of their hypotheses in various fields. The objective of this article is to analyze the following concept of critical value.
- Critical value Definition
- Importance of Critical Value
- Formula to calculate
- Categories of Critical Value
- Critical Value Examples
Let’s elaborate on all the above concepts and gain more grip on the topic of critical value.
Defining Critical Value:
The critical value is pivotal in the distribution of a test statistic that delineates the boundary between rejecting and failing to reject the null hypothesis in a hypothesis test. It acts as a gatekeeper and determines whether the observed data is considered statistically significant or not.
Key points:
- It is determined based on the α (significance level), the chosen probability of making a Type I error (rejecting a true null hypothesis).
- It is influenced by the type of test (one-tailed or two-tailed) and the distribution of the test statistic (e.g., z-distribution, t-distribution, chi-square distribution).
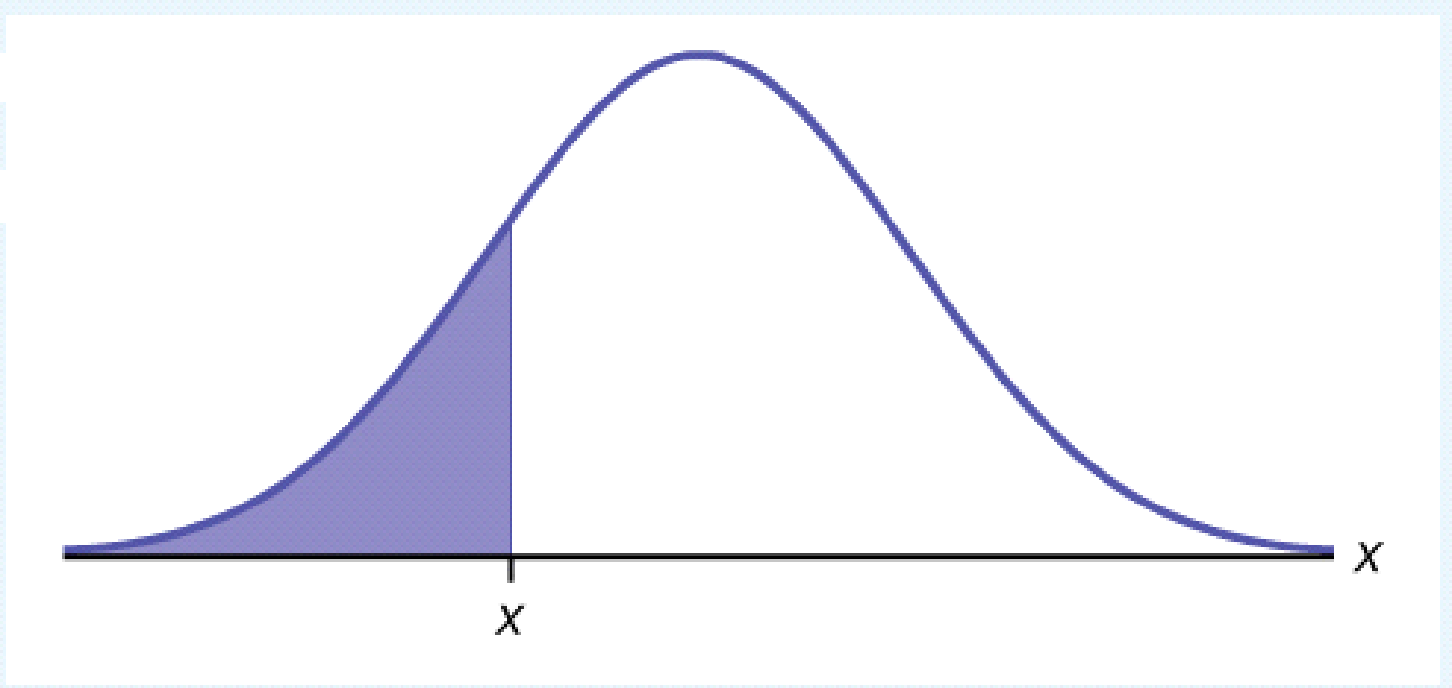
Visual representation:
Importance of Critical Value:
- Critical values indicate whether results are statistically significant or merely due to chance.
- They validate findings by establishing boundaries for acceptable outcomes in experiments or analyses.
- Critical values help in making informed decisions by providing thresholds for accepting or rejecting hypotheses.
- They set benchmarks and standards for quality control, ensuring consistency and reliability.
- In risk analysis, they pinpoint extreme scenarios or outliers that might have substantial consequences.
- Critical values aid in estimating parameters within a given confidence interval, increasing result accuracy.
- They form the basis for compliance standards and regulations across various industries.
Formula to calculate:
The critical value in statistical formulas relies on the distribution of the test statistic, leading to various formulas for its determination. Among these, a widely used approach involves establishing confidence intervals or significance levels to derive the critical value.
Types of Critical Value:
The type of critical value used depends on the distribution of the test statistic employed in a particular statistical test. Here are several types of critical values based on different test statistic distributions:
- T-Distribution Critical Values
- Chi-Square Distribution Critical Values
- F-Distribution Critical Values
- Z-distribution Critical Values
- T-Distribution Critical Values:
For smaller sample sizes or when the population standard deviation is unknown, critical values are derived from the t-distribution. This distribution is similar to the normal distribution but accounts for the variability due to smaller sample sizes.
Steps to calculate t critical value using the t-distribution:
Step 1: Identify the sample size (n) and subtract 1 to obtain degrees of freedom (df). (df = n – 1)
Step 2: Select the desired significance level (α).
Step 3: Find the critical value that corresponds to the chosen α and degrees of freedom (df) by using a t-distribution table or statistical software.
Step 4: If the absolute value of the calculated t-statistic exceeds the critical value obtained from the table or software then the results are considered statistically significant at the chosen α level. This may lead to rejecting the null hypothesis.
- Chi-Square Distribution Critical Values:
Commonly used in tests involving categorical data or goodness-of-fit tests, critical values are taken from the chi-square distribution.
Steps to Calculate Critical Values Using Chi-Square Distribution:
Step 1: Determine degrees of freedom (df).
Step 2: Specify the desired significance level (α).
Step 3: Compute the critical value for the chosen α and degrees of freedom (df) by referring to a chi-square distribution table or using software.
Step 4: Compare the calculated chi-square statistic to the critical value.
- F-Distribution Critical Values:
This distribution is employed in ANOVA (Analysis of Variance) tests or regression analysis. Critical values are derived from the F-distribution, which accounts for variability between sample means.
Steps to Calculate Critical Values Using F- F-Distribution:
Step 1: Identify numerator and denominator degrees of freedom.
Step 2: Choose significance level (α)
Step 3: Compute the critical value for the chosen α, numerator degrees of freedom, and denominator degrees of freedom by referring to an F-distribution table or using software.
Step 4: Compare the calculated F-statistic to the critical value.
Statistic for testing with a large sample size: f = σ12 / σ22
Statistic for testing with a small sample size: f = S12 / S22
- Z Critical Values:
Z critical value is a value derived from the standard normal distribution and is used in statistical hypothesis testing, particularly in situations where the sample size is large or when the population SD (Standard Deviation) is known.
Steps to Calculate Critical Values Using Z – Distribution:
Step 1: Determine the significance level (α).
Step 2: Deduct α from one for a 2-tailed test.
Step 3: Deduct α from 0.5 for a 1-tailed test.
Step 4: Refer to a standard normal distribution table or use statistical software to find the Z-value corresponding to the chosen significance level.
Example demonstrating the application of Critical Values:
Example 1: Z-distribution Critical Value Calculation
For a significance level (α) of 0. 15 in a two-tailed test, find the critical Z-value.
Solution:
- Determine the significance level: α = 0.15.
- For a two-tailed test, subtract α from 1: 1 – 0.15 = 0.85.
- Use a standard normal distribution table or software to find the Z-value corresponding to a cumulative probability of 0.85.

Let’s say it’s approximately 1.04
Therefore, the critical Z-value for a two-tailed test at α = 0.15 is approximately 1.04.
Wrap up:
This article explored the pivotal role of critical values in hypothesis testing, emphasizing their determination based on significance levels. It detailed the significance, categories, and calculations involving various distributions.